Background
In CUDA, we define a CUDA kernel, which is a function (e.g., C++ function) executed by CUDA.
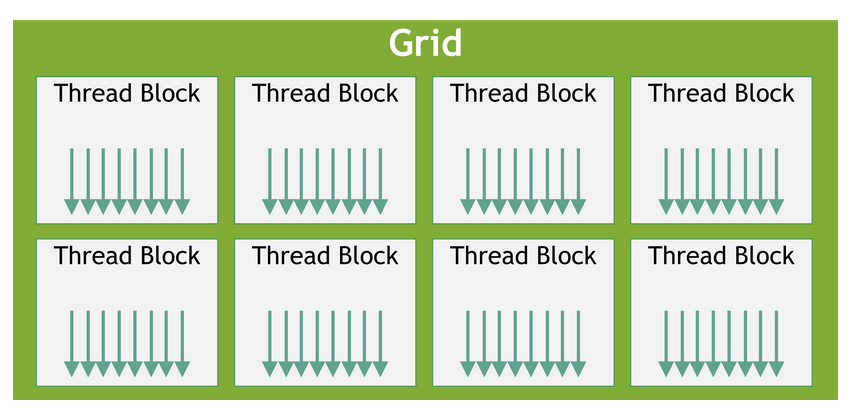
In the CUDA programming model, there is a three-level hierarchy. The threads are the smallest unit of execution. These threads are grouped into a CUDA thread block. CUDA blocks are grouped into arrays called grids. The kernel is written from the perspective of a single thread in CUDA. Thus, a kernel is executed as a grid of blocks of threads ref.

General Guidelines
-
Thread Block Size
- Choose a multiple of 32 (warp size) for optimal performance[1][2].
- Common choices are 128, 256, or 512 threads per block[2][5].
- Avoid extremely small (<32) or large (>512) block sizes[6].
-
Grid Size
- Calculate based on your problem size and chosen block size[4].
- Ensure you launch enough blocks to cover your entire dataset.
Factors to Consider
Hardware Constraints
- Check your GPU’s limits using
cudaGetDeviceProperties[2]:- Max threads per block
- Max blocks per multiprocessor
- Number of multiprocessors
Occupancy
- Aim to maximize occupancy (active threads per SM)[1][5].
- Use CUDA’s occupancy calculator or runtime functions like
cudaOccupancyMaxPotentialBlockSize[5].
Problem Size
- Adjust grid size based on your data dimensions[4]:
dim3 block(32, 8, 4);
dim3 grid((dimx+block.x-1)/block.x, (dimy+block.y-1)/block.y, (dimz+block.z-1)/block.z);
Kernel Characteristics
- Consider shared memory usage and register pressure[1].
- More complex kernels may benefit from smaller block sizes.
Optimization Process
-
Start with a Baseline
- Begin with 256 or 512 threads per block[6].
- Use
cudaOccupancyMaxPotentialBlockSizefor an initial estimate[5].
-
Profile and Benchmark
- Use CUDA profiling tools to measure performance.
- Experiment with different block sizes within the 128-512 range[2].
-
Fine-tune
- Adjust based on specific kernel requirements and GPU architecture.
- Consider using dynamic parallelism for complex problems.
-
Iterate
- Repeat the process for different input sizes and GPU models.
Example Calculation
const int problemSize = 1000000;
int threadsPerBlock = 256; // Starting point
int blocksPerGrid = (problemSize + threadsPerBlock - 1) / threadsPerBlock;

myKernel<<<blocksPerGrid, threadsPerBlock>>>(args...);
there’s no one-size-fits-all solution. The optimal config requires experimentation and is specific to your kernel, data size, and target GPU[1][2][6].
Ref Links: [1] https://stackoverflow.com/questions/4391162/cuda-determining-threads-per-block-blocks-per-grid [2] https://www.reddit.com/r/CUDA/comments/11sn3g6/maxing_out_the_device/ [3] https://docs.nvidia.com/cuda/cuda-c-best-practices-guide/ [4] https://forums.developer.nvidia.com/t/how-can-i-calculate-blocks-per-grid/248491 [5] https://stackoverflow.com/questions/9985912/how-do-i-choose-grid-and-block-dimensions-for-cuda-kernels/9986748 [6] https://forums.developer.nvidia.com/t/getting-the-best-performance/274000 [7] https://numba.pydata.org/numba-doc/dev/cuda/kernels.html
Project Plan
December 5th Meet Notes: Instead of a correlation matrix as nonlinear, we cannot isolate individual coordination, short or wide, or square; whole shape should be considered, for example, based on kernel memory vs compute parallelism. Can have 3D plot thread, block, time, can be the 3d plot with power limit layered, IMP: check saw tooth, powers of 2, multiples of 32.
Outline:
Given a Cuda code, create an optimizer that detects the most optimal shape of the kernel.
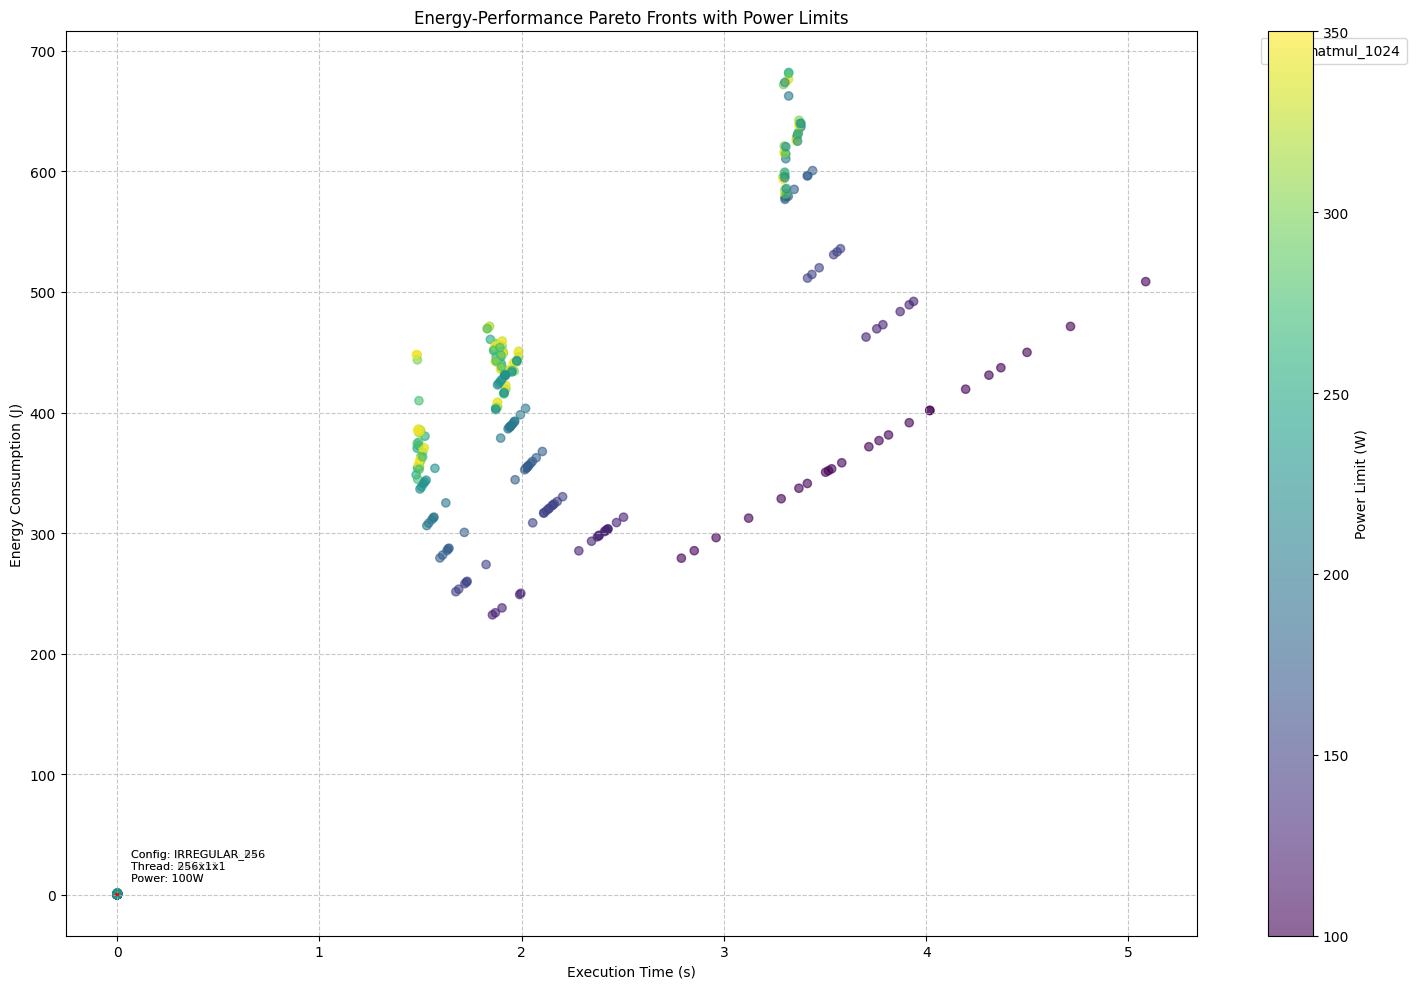
Plot latency vs. energy Pareto curve for different values of shapes of the kernel.
The optimizer should use a predictive model to converge and predict the optimized shape. Use llvm ir static analysis here to extract features.


For validation, create a Pareto curve of predicted vs. actual Pareto curve.
RQ 1: what features contribute to energy and hardware architecture intuition behind it, use naive cuda kernels?
RQ 2: Does changing its values create an opportunity for optimization? Energy vs Time tradeoff?
RQ 3: how does the optimizer work in the wild, run it on benchmark?
RQ 4: Baselines?
Get optimization functions from the Kerneltuner repo and cite them.
Research Goal
To develop a model that optimizes CUDA kernel energy consumption through runtime configuration adjustment while maintaining performance requirements.
CUDA Kernel Energy Optimizer
A framework for optimizing CUDA kernels for energy efficiency using techniques such as LLVM IR analysis, power modeling, energy prediction, and adaptive configuration optimization to minimize energy consumption while maintaining performance.
Summary of current findings

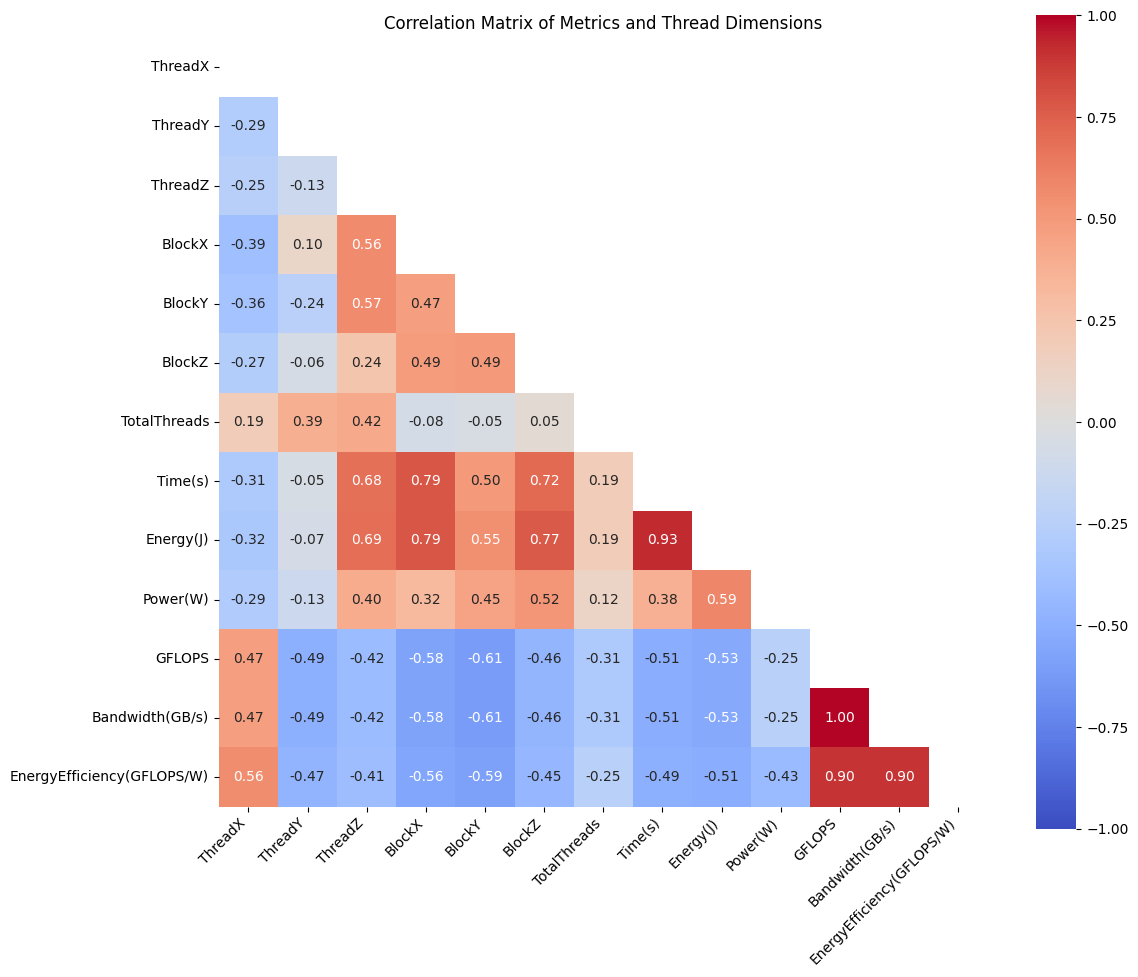
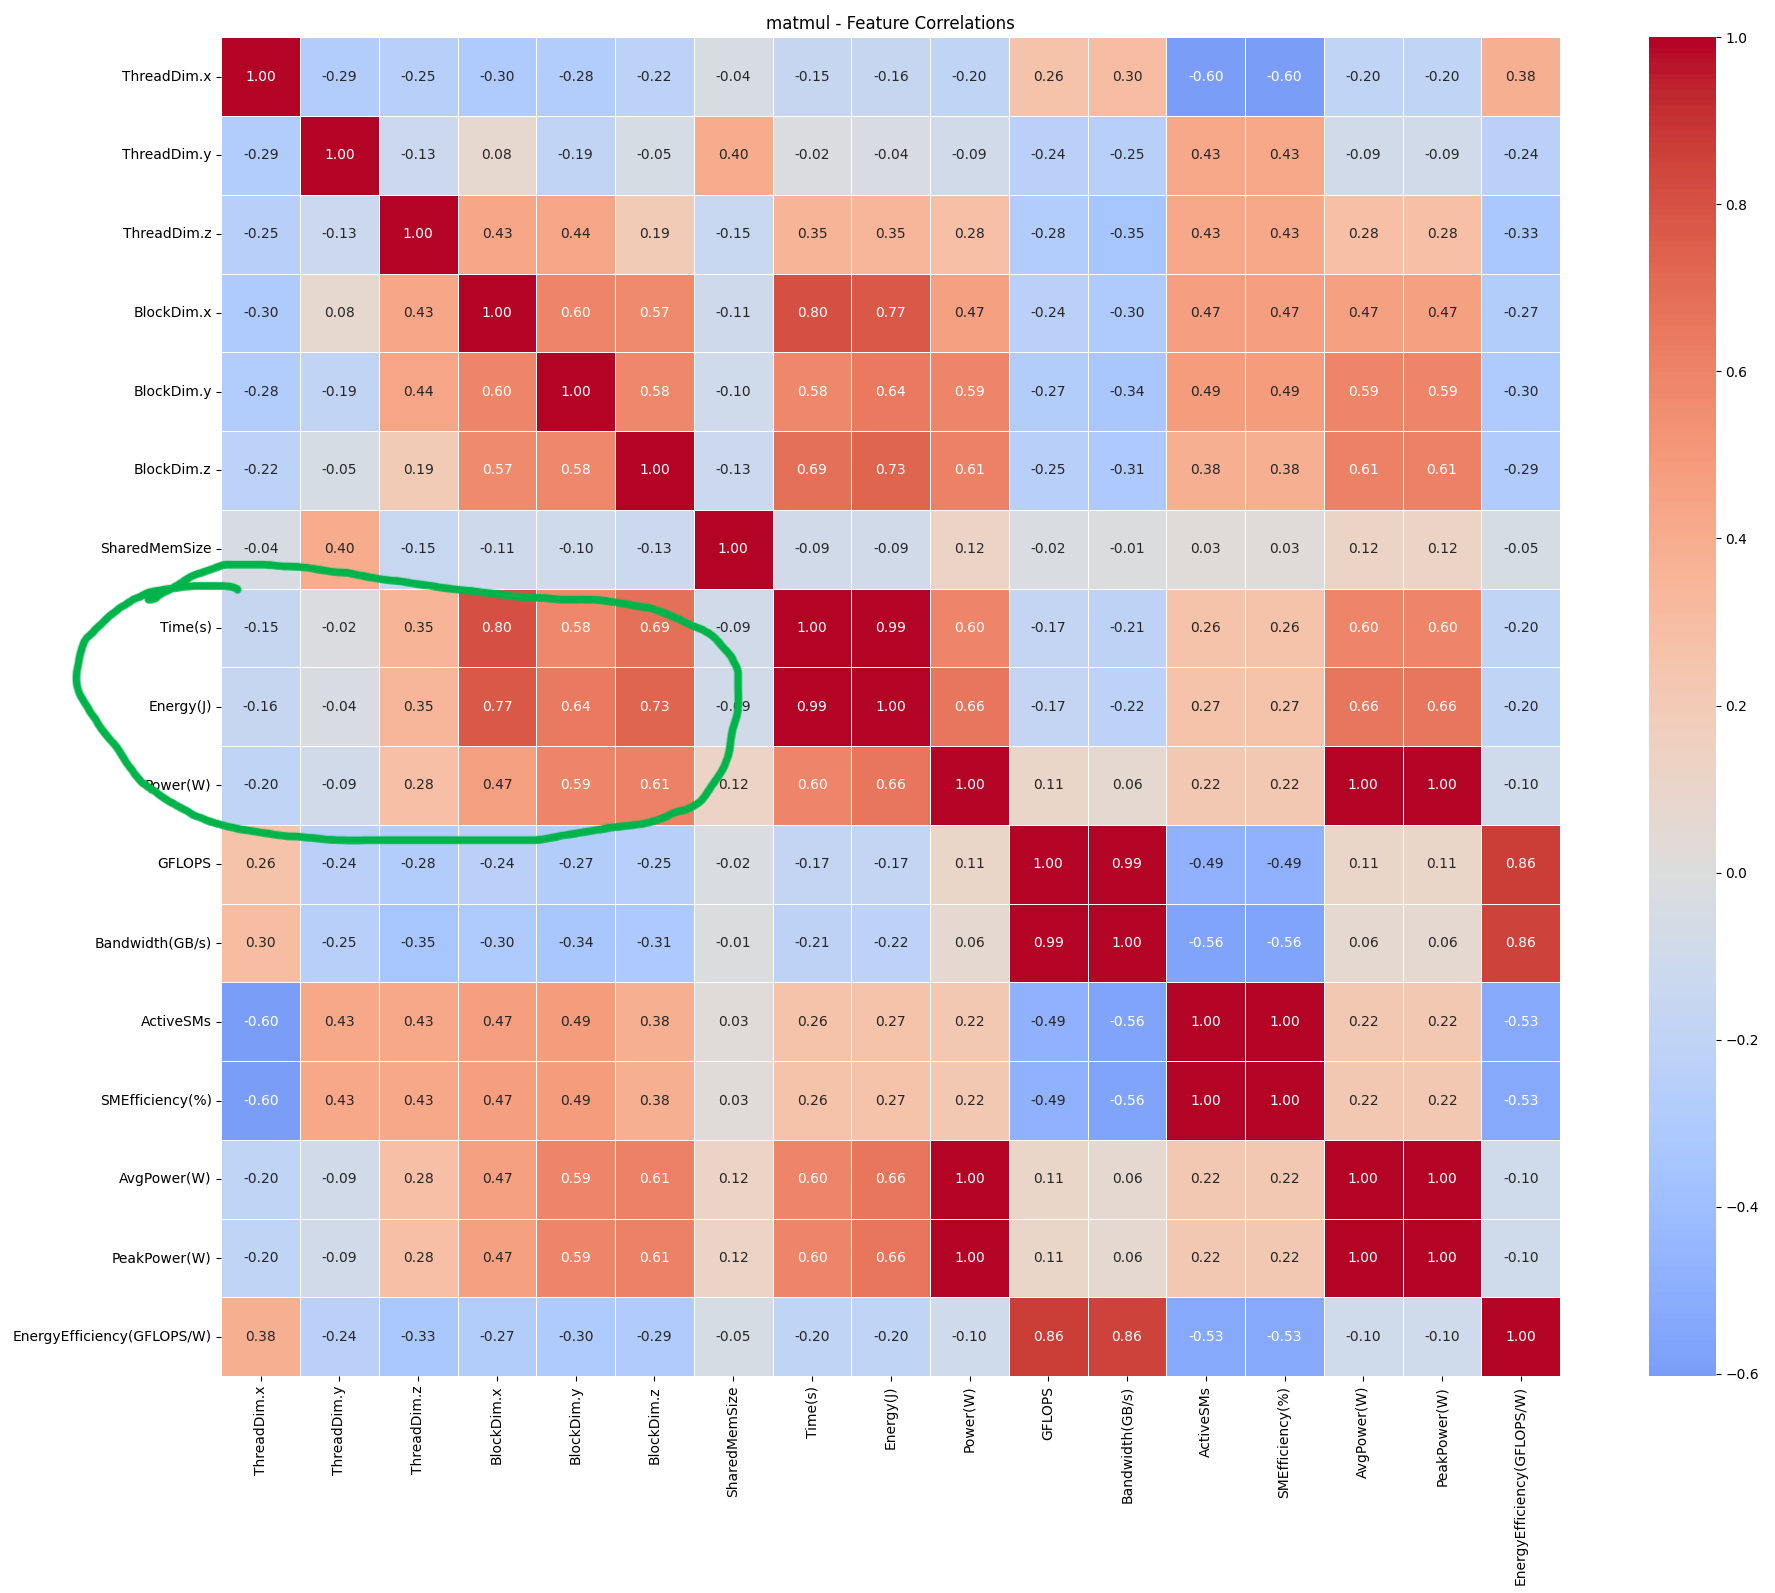
Current empirical analysis reveals a strong correlation between CUDA kernel dimensions(thread, block shape) and energy consumption patterns. Specifically, thread block size and grid dimensions demonstrate non-linear and highly correlated relationships(check the green highlight) with energy efficiency, where optimal configurations often deviate from maximum occupancy settings. We observed that kernels with similar computational characteristics exhibit consistent energy consumption patterns, suggesting that energy optimization can be effectively modeled and predicted. This finding forms the foundation of our optimizer, which use these dimensional relationships to predict and configure kernel launch parameters for minimal energy consumption while maintaining performance constraints. The relationship is particularly pronounced in compute-bound kernels, where thread block sizes show up to 30% variation in energy consumption across different configurations, providing a substantial optimization opportunity.
Key Features of our Framework/Tool
- LLVM IR Analysis: Performs in-depth static analysis of CUDA kernels using LLVM IR to extract key characteristics, such as instruction mix, memory access patterns, and compute intensity.
- Energy Prediction: Utilizes a machine learning-based model(currently, but can be updated later on to have a mathematical model) to predict energy consumption of CUDA kernels based on their characteristics.
- Adaptive Configuration Optimization: Dynamically optimizes kernel configurations, including thread block size, grid size, shared memory usage, and cache preference, to minimize energy consumption while meeting performance targets. Note: Beginning with shape.
- Multi-Target Optimization: Supports optimization for various targets, including energy efficiency, balanced performance, and maximum performance. So basically we can give the user control on how they want to run the kernel, either prioritizing performance(includes time), energy, or some balanced optimized approach.
Components (As per the current vrsion of the code but can be changed/updated)
- Optimization Manager: Coordinates the optimization process, including LLVM IR analysis, energy prediction, and configuration optimization.
- LLVM Analyzer: Performs LLVM IR analysis of CUDA kernels to extract key characteristics.
- Energy Predictor: Predicts energy consumption of CUDA kernels based on their characteristics.
- Configuration Optimizer: Dynamically optimizes kernel configurations to minimize energy consumption while meeting performance targets.
Usage
To use the CUDA Kernel Energy Optimizer, simply execute the optimizer.py script with the following arguments:
kernel_file: Path to the CUDA kernel file to optimize.--target: Optimization target (energy_efficient, balanced, or performance).--output: Path to save optimization results.
Example usage:
python optimizer.py --kernel_file path/to/kernel.cu --target energy_efficient --output optimization_results.jsonOptimization Results
The optimization results will be displayed on the console and saved to the specified output file (if provided). The results include:
- Optimal configuration: The optimized kernel configuration, including thread block size, grid size, shared memory usage, and cache preference.
- Predicted energy savings: The estimated energy savings of the optimized configuration compared to the original kernel.
- Detailed metrics: Additional metrics, such as shared memory usage, thread block size, grid size, cache preference, and power target. Note: Starting with power consumption for now.
System Requirements
- Python 3.8 or later
- LLVM 11 or later
- CUDA 11 or later
- NVIDIA GPU with CUDA support
Key Research Questions
- What are the key static features that strongly correlate to energy, energy efficiency, power and time?
- How do different selected features from RQ1 (kernel configurations (thread/block dimensions)) impact energy consumption patterns?
- Can we identify configurations that reduce energy consumption faster than they increase execution time? This will be the part where we describe the base energy optimizer.
- How can we effectively balance multiple optimization objectives (energy, performance, resource utilization)? This will be the part where we describe the multi objective energy optimizer for a balanced approach. Note: RQ’s will be polished/updated/added
Methodology
1. Data Collection & Analysis
a. Kernel Metrics:
   - Energy consumption
   - Power usage patterns
   - Execution time
   - FLOPS/bandwidth
   - Temperature profiles
   - Shape parameters (thread/block dimensions)
   - Resource utilization metrics

b. Analysis Focus:
   - Correlation between shape parameters and energy consumption
   - Impact of different configurations on power/performance
   - Identification of energy efficiency patterns
   - Multi-dimensional performance analysis
2. Feature Engineering
a. Primary Features:
   - Thread dimensions (x,y,z)
   - Block dimensions (x,y,z)
   - Grid configuration
   - Memory access patterns
   - Compute intensity

b. Derived Metrics:
   - Energy efficiency (FLOPS/Watt)
   - Resource utilization ratios
   - Power/Performance indices
3. Multi-Objective Optimization Model
Objective Functions:
f₁(x) = Energy(x)        → minimize
f₂(x) = Time(x)          → minimize
f₃(x) = -Performance(x)  → minimize
f₄(x) = Resources(x)     → optimize

Subject to:
- Performance constraints
- Power limits
- Resource bounds
- Temperature thresholds
4. Runtime Optimization System
Components:
1. Static Analyzer
   - Kernel characteristic extraction
   - Initial configuration prediction

2. Dynamic Optimizer
   - Real-time monitoring
   - Configuration adjustment
   - Performance/energy tracking

3. Feedback System
   - Configuration effectiveness evaluation
   - Model updates
   - Parameter refinement
Validation Strategy
1. Benchmark Suite
Initial Test Kernels:
- Matrix operations (GEMM, convolution)
- Memory-intensive operations
- Compute-bound operations
- Mixed workloads

Metrics:
- Energy consumption
- Execution time
- Resource utilization
- Temperature profiles

Final Optimizer Validation on Rodinia/Altis benchmark, and some cuda based LLM frameowrk like LLama.cpp
2. Testing Environment
Hardware:
- RTX 3070 Ti
- A5000
- Macbook (for testing silicon chip), in future i want to explore their MLX framework whihc they havbe optimized for their M silicon chip on on device apple intelligence
- Raspberry Pi 5 with Coral edge TPU

Measurement Tools:
- NVIDIA NVML
Expected Outcomes
-
Energy Optimization Model:
- Predictive model for energy consumption
- Configuration optimization algorithm
- Runtime adjustment system
-
Analysis Insights:
- Energy consumption patterns
- Configuration impact analysis
- Performance-energy trade-offs
-
Practical Tools:
- Energy optimization library
- Configuration recommendation system
- Runtime monitoring tools
Next Steps
- Progress:
Till now:
- Conduct benchmark tests with various configurations
- Analyze correlation between shape parameters and energy

Next step:
- Develop initial optimization models (Incorporate machine learning techniques)
- Validate measurement methodology
- Future Work:
- Expand to different GPU architectures
- See if we can use lightweiught architecture agnostic mathemcatical model insteaf of ml model
- Develop automated optimization strategies
- Create comprehensive configuration guidelines
Key Findings from Benchmark Data
- Thread/Block Configuration Impact:
a. Thread, block shapes are strongly correlated to energy, power and time. Also observed is that this correlation increases as we increase dimension and go towards y, and z from x.

b.Performance Scaling:
- ThreadDim.x shows strongest correlation with GridDim.y (0.377-0.412 across kernels)
- Thread dimensions have non-linear scaling with performance
- Optimal thread counts vary by kernel type:
  * MATMUL: 256-384 threads optimal
  * VECADD: 128-256 threads optimal
  * REDUCTION: 32-128 threads optimal
  * SPMV: 128-256 threads optimal
  * CONV: 64-128 threads optimal

c. Energy Impact:
- Power consumption increases ~1.3-1.6x for 2x thread increase
- Energy efficiency shows diminishing returns beyond certain thread counts
- Different scaling patterns observed:
  * MATMUL: Energy scales ~2.9x for 2x size increase
  * VECADD: Energy scales ~1.03x for 2x size increase
  * REDUCTION: Energy scales ~0.98x for 2x size increase
- Memory Access Patterns:
a. Bandwidth Utilization:
- Strong correlation between thread configuration and memory throughput
- MATMUL: 2.46x bandwidth increase for 2x size
- VECADD: 2.38x bandwidth increase for 2x size
- REDUCTION: 2.94x bandwidth increase for 2x size

b. Cache Behavior ***note: needs more validtation***:
- L2 cache usage shows non-linear scaling
- Shared memory utilization varies significantly by kernel type
- Memory throughput plateaus at different thread counts for different kernels
- Power and Energy Characteristics:
a. Power Scaling:
- Base power: 67-70W
- Peak power: 100-130W depending on kernel
- Power increase with thread count (but no super strong patternj detected):
  * Linear up to 256 threads
  * Sub-linear beyond 256 threads

b. Energy Efficiency:
- GFLOPS/W shows optimal points:
  * MATMUL: 4.07x improvement for 2x size
  * VECADD: 2.38x improvement for 2x size
  * REDUCTION: 2.94x improvement for 2x size
Refined Research Objectives
- Multi-Objective Optimization:
Primary Objectives:
- Minimize Energy(x) = Power(x) × Time(x)
- Maximize Performance(x) = GFLOPS(x)
- Optimize ResourceUtilization(x)

Subject to:
- Power(x) ≤ PowerLimit
- Temperature(x) ≤ TempLimit
- Performance(x) ≥ PerformanceTarget
- Configuration Space:
Search Parameters:
- Thread dimensions: (4-1024, 1-32, 1-16)
- Block dimensions: (1-1024, 1-1024, 1-1024)
- Shared memory allocation
- Register/Cache usage

Constraints:
- Total threads ≤ MaxThreadsPerBlock
- Active blocks ≤ MaxBlocksPerSM
- Shared memory ≤ MaxSharedMemory
- Optimization Strategy:
Phase 1: Static Analysis
- Kernel characteristics extraction
- Memory access pattern analysis
- Compute intensity calculation

Phase 2: Dynamic Optimization
- Online power monitoring
- Performance tracking
- Configuration adjustment

Phase 3: Feedback Loop
- Energy efficiency measurement
- Configuration refinement
- Model updates
Key Correlation Insights
- Block Dimension Impacts:
a. Z-Dimension Effects:
- Strongest correlation with power consumption across kernels (0.54-0.78)
- BlockDim.z → Power correlation increases with matrix size:
  * MATMUL: 0.54 correlation
  * VECADD: 0.78 correlation
  * REDUCTION: 0.71 correlation
  * SPMV: 0.58 correlation

b. X/Y-Dimension Effects:
- BlockDim.x/y show moderate correlation with energy (0.49-0.71)
- More significant impact on larger matrix sizes
- MATMUL: BlockDim.x→Energy correlation of 0.795
- VECADD: BlockDim.x→Energy correlation of 0.751
- Energy-Performance Relationships:
a. Time-Energy Correlation:
- Very strong correlation across all kernels (0.97-1.0)
- Correlation strengthens with matrix size:
  * Small matrices (128): 0.15-0.29
  * Large matrices (4096): 0.97-1.0

b. Power-Energy Correlation:
- Moderate to strong (0.48-0.74)
- Varies by kernel type:
  * MATMUL: 0.48
  * VECADD: 0.74
  * REDUCTION: 0.70
  * SPMV: 0.61
- Performance Metrics:
a. GFLOPS Correlations:
- Strong correlation with bandwidth (0.94-1.0)
- GridDim.y shows consistent positive correlation (0.81-0.95)
- ThreadDim.x shows weak to moderate correlation (0.27-0.44)

b. Energy Efficiency:
- Nearly perfect correlation with GFLOPS (0.97-1.0)
- Stronger correlation with thread dimensions in compute-bound kernels
- Weaker correlation in memory-bound kernels
- Hardware Utilization (needs more validation):
a. ActiveWarps Impact:
- Moderate correlation with energy (0.33-0.61)
- Stronger impact on compute-bound kernels
- Weak correlation with power consumption (0.21-0.33)

b. Shared Memory:
- Weak to moderate correlation with power (0.07-0.32)
- Correlation increases with matrix size
- More significant impact on MATMUL and SPMV
Optimization Implications
- Configuration Guidelines:
Primary Parameters (by importance):
1. BlockDim.z (highest power/energy impact)
3. BlockDim.x/y (balanced energy-performance impact)

Secondary Parameters:
1. ThreadDim.x (moderate performance impact)
2. SharedMemSize (kernel-specific impact)
3. ActiveWarps (compute-bound optimization)
- Kernel-Specific Strategies (intitial findings):
MATMUL:
- Focus on BlockDim.z optimization (0.54 power correlation)
- Optimize shared memory usage

VECADD:
- Prioritize BlockDim.z (0.78 power correlation)
- Minimize shared memory usage

REDUCTION:
- Balance BlockDim.z and GridDim.y
- Monitor power-performance trade-offs

SPMV:
- Optimize BlockDim.z and BlockDim.y
- Focus on memory access patterns
- Balance thread and block dimensions
Power Limit Analysis and Results
- Default vs Optimized Power Limits:
Kernel-Specific Power Configurations:
MATMUL:
- Default limit: 290W
- Optimized limit: 125W (based on mean power draw)
- Results:
  * Power reduced: 125.6W → 93.5W (-25.6%)
  * Energy reduced: 63.4J → 45.3J (-28.5%)
  * GFLOPS impact: 3299.6 → 3291.4 (-0.25%)
  * Energy efficiency: 30.7 → 36.3 GFLOPS/W (+18.2%)

CONV:
- Default limit: 290W
- Optimized limit: 130W
- Results:
  * Power reduced: 133.8W → 91.0W (-32.0%)
  * Energy reduced: 110.7J → 76.1J (-31.2%)
  * Time impact: 0.436s → 0.584s (+33.9%)
  * Active SMs: 15336 → 19289 (+25.8%)

VECADD:
- Default limit: 290W
- Optimized limit: 100W
- Results:
  * Power reduced: 97.6W → 76.0W (-22.1%)
  * Energy reduced: 5.9J → 4.5J (-23.7%)
  * GFLOPS impact: 102.2 → 59.1 (-42.2%)
  * Bandwidth: 1226.4 → 708.7 GB/s (-42.2%)

SPMV:
- Default limit: 290W
- Optimized limit: 120W
- Results:
  * Power reduced: 88.3W → 85.1W (-3.6%)
  * Energy reduced: 8.0J → 7.9J (-1.3%)
  * Execution time: 0.0633s → 0.0634s (+0.15%)
  * Active SMs: 24467 → 24469 (negligible change)

REDUCTION:
- Default limit: 290W
- Optimized limit: 100W
- Results:
  * Power reduced: 79.4W → 71.6W (-9.8%)
  * Energy reduced: 0.425J → 0.408J (-4.0%)
  * GFLOPS impact: 4.48 → 4.24 (-5.4%)
  * Energy efficiency: 0.058 → 0.060 GFLOPS/W (+3.4%)
- Key Findings:
a. Energy-Performance Trade-offs:
- Compute-intensive kernels (MATMUL):
  * Minimal performance impact with significant energy savings
  * Best candidate for power limit optimization
  * Energy efficiency improved despite power reduction

- Memory-intensive kernels (VECADD, CONV):
  * Larger performance impact from power limiting
  * Trade-off between energy savings and performance
  * Bandwidth significantly affected by power limits

- Mixed kernels (REDUCTION, SPMV):
  * Moderate impact on both performance and energy
  * Smaller benefit from power limiting
  * Better tolerance to power constraints
- Hardware Utilization Impact (needs more validation):
a. Resource Changes:
- Active SMs:
  * MATMUL: 5492 → 16322 (+197%)
  * CONV: 15336 → 19289 (+25.8%)
  * VECADD: 25298 → 29172 (+15.3%)
  * SPMV: 24467 → 24469 (~0%)
  * REDUCTION: 18548 → 24347 (+31.3%)

b. Memory Behavior:
- L2 Cache Usage:
  * Generally increased under power limits
  * More efficient memory access patterns
  * Better cache utilization with lower power
- Optimization Implications:
a. Kernel-Specific Strategies:
- Compute-bound kernels:
  * Aggressive power limiting possible
  * Focus on maintaining SM efficiency
  * Monitor energy efficiency gains

- Memory-bound kernels:
  * Conservative power limiting
  * Preserve memory bandwidth
  * Balance energy savings vs performance

b. Configuration Guidelines:
- Set power limits based on kernel type
- Consider workload characteristics
- Monitor performance metrics for threshold effects
- Energy Efficiency Optimization:
Best Practices:
1. Profile kernel power draw
2. Set power limit slightly above mean usage
3. Monitor performance impact
4. Adjust based on application requirements

Trade-off Considerations:
- Performance degradation tolerance
- Energy savings requirements
- Thermal constraints
- Application-specific metrics
LLVM-Based Static Analysis
1. Kernel Analysis Components:
   a. LLVM IR Generation:
      - Direct CUDA to LLVM IR compilation using clang++
      - Architecture-specific targeting (sm_86). This is for 3070, but will change
        for archuitecture of the gpu
      - Device-only code generation (device here means cuda/gpu)

   b. Instruction Analysis:
      - Arithmetic operations (integer, floating-point, special)
      - Memory operations (load, store, atomic)
      - Control flow instructions
      - Register usage patterns

   c. Memory Access Analysis:
      - Global memory access patterns
      - Shared memory utilization
      - Local memory usage
      - Memory coalescing detection

2. Analysis Metrics:
   a. Compute Intensity:
      - Ratio of compute to memory operations
      - Instruction mix analysis
      - Operation type distribution

   b. Memory Patterns:
      - Coalesced access detection
      - Strided access patterns
      - Bank conflict analysis
      - Memory divergence scoring

   c. Resource Utilization:
      - Register pressure analysis
      - Shared memory requirements
      - Thread hierarchy analysis
Configuration Optimization System till now
1. Static Analysis Pipeline:
   a. LLVM IR Generation:
      - CUDA source parsing
      - Clang++ compilation
      - IR verification

   b. Characteristic Extraction:
      - Instruction analysis
      - Memory pattern detection
      - Resource requirement analysis

2. Configuration Generation:
   a. Thread Hierarchy:
      - Dimension optimization
      - Warp alignment
      - Occupancy maximization

   b. Memory Configuration:
      - Shared memory allocation
      - Cache preference selection
      - Memory carveout optimization

3. Power Management:
   a. Adaptive Power Control:
      - Compute-intensity based scaling
      - Memory-aware power limits
      - Thermal constraint handling

   b. Clock Management:
      - GPU clock optimization
      - Memory clock adjustment
      - Thermal-aware scaling
Planned Implementation Details
1. Core Components:
   a. LLVMAnalyzer:
      - LLVM IR parsing and analysis
      - Pattern detection
      - Metric calculation

   b. ResourceAnalyzer:
      - Hardware capability analysis
      - Resource utilization tracking
      - Occupancy calculation

   c. ConfigurationOptimizer:
      - Thread/block optimization
      - Memory configuration
      - Power management

2. Analysis Pipeline:
   a. Static Analysis:
      - LLVM IR generation
      - Instruction analysis
      - Pattern detection

   b. Dynamic Optimization:
      - Configuration generation
      - Performance prediction
      - Resource optimization
Optimization Strategies (note: needs works)
1. Thread Optimization:
   - Warp-aligned thread counts
   - Memory access pattern consideration
   - Occupancy-aware distribution

2. Memory Configuration:
   - Shared memory allocation
   - Cache preference selection
   - Bank conflict avoidance

3. Power Management:
   - Compute-intensity based limits
   - Memory-aware clock settings
   - Thermal constraint handling
Questions:
- What happens inside the machine when you change power limit(is this power gating?), is the core usage decreased, is the clocking reduced, is the memory bus cycle reduced? This should be in an RQ, if not an independent RQ in itself?
- How can we categorize Cuda Kernels, do ml related clustering to create categories and then apply optimization strategies to those kernels?
- Power P would be sum of runtime power plus the idle/static power of the hardware.
- We should take/predict number of SM’s used, and memory.
- Categorize all types of LLVM instructions and give them a score compute/memory empirically? Since LLVM instructions are agnositic to the language it should work for other languages too, for now limited to GPU’s
- People consider idle power as constants can we empirically get it’s value based on the GPU architecture?
- Can we get clock cycles for each instruction type and hence estimate time take for them to execute?
- Plot 3 of IPP is nice, can have something similar?
- Ensure LLVM takes control flow
- Etotal = Σ[Pcompute(t) + Pmemory(t)]·Δt
Compute Power: Pcompute = α·FLOPS + β·Utilization
- α: Compute intensity scaling factor (dynamic)
- β: SM utilization weight (hardware-specific)
- FLOPS: Measured from kernel characteristics
- Utilization: Tracked via hardware counters
Memory Power: Pmemory = γ·Bandwidth + δ·AccessPattern
- γ: Memory efficiency scaling factor
- δ: Access pattern weight (coalesced vs strided)
- Bandwidth: Memory operations/time
- Access patterns: Coalescing score (0-1)